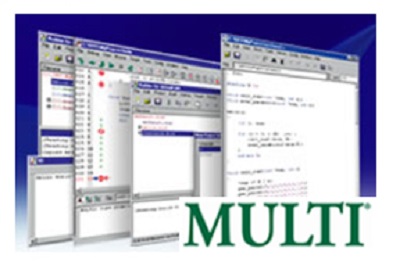
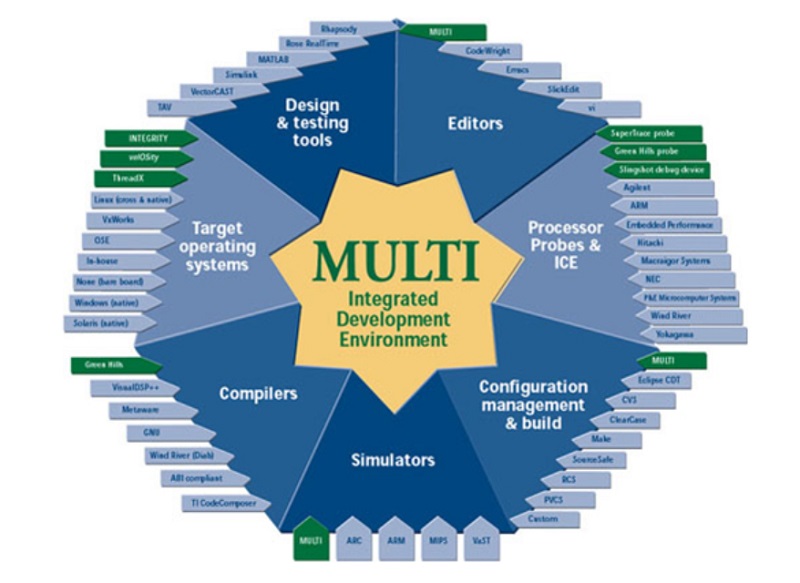
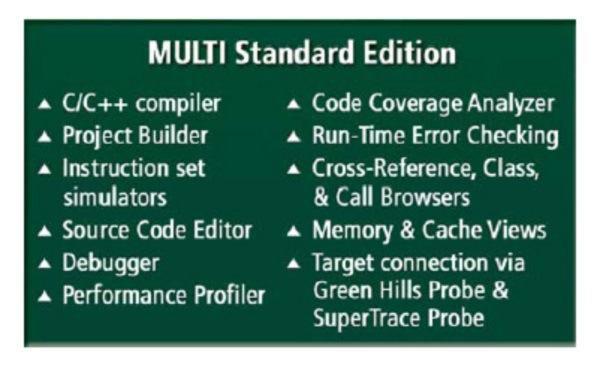
 Green Hills Software MULTI IDE (Integrated Development Environment)
 GHS MULTI IDE

 Feature
- Find and fix bugs faster
- Make sense of complex systems
- Boost productivity
- Debug embedded Linux
- Maximize performance
- Benefit from an expert
- Lower your production cost
- Functional safety confidence
After more than three decades of customer use and continuous enhancement, the MULTI IDE is unmatched in the embedded software industry.
Developers know they can rely on MULTI to help them produce high-quality code and get their devices to market faster.
Whether pinpointing a hard-to-find bug, resolving a memory leak, or maximizing system performance—MULTI consistently works.
 Structure


Description
1. Find and fix bugs faster

An invaluable part of the TimeMachine tool suite, the PathAnalyzer provides a view of your application’s call stack over time.
This powerful display makes complex system execution flow easy-to-understand, enabling you to find bugs faster.
Every feature of our revolutionary Debugger is designed to quickly solve problems that stump traditional tools.
It often takes weeks or months to track down problems like inter-task corruptions, missed real-time requirements, and external hardware events.
Green Hills’ TimeMachine tool suite helps you solve the same problems in hours or even minutes.
The TimeMachine tool suite automatically captures program execution data, combining the MULTI Debugger interface with innovative replay debugging capabilities.
When debugging with TimeMachine, you can step, run, and debug forwards and backwards through code to pinpoint the root cause of the problem.
At any point in the TimeMachine capture you can:
- Debug task interactions at the source level
- Find specific data points by using powerful execution and data breakpoints
- Examine RTOS data structures
- Debug virtual memory applications
DoubleCheck, Green Hills’ integrated static analyzer, saves you time and money by allowing you to identify programming errors even before running your program.
Because DoubleCheck is part of the Green Hills Compilers, there’s no setup cost to enabling it.
Simply set an option and DoubleCheck reviews source code each time it’s compiled.
Additionally, DoubleCheck runs much faster than traditional static analysis tools, which means that every developer can have it on all the time.
Run-time error checking complements DoubleCheck by finding bugs that cannot be identified by static analysis alone.
Especially heinous bugs remain silent for a long time before failure. With run-time error checking, you’re alerted to the cause of the problem when it happens.
Fixing a bug is trivial when you’re looking directly at it.
2. Make sense of complex systems

MULTI’s synchronous run control halts all cores in a multicore system simultaneously.
This enables you to debug one core without worrying that operations running on another core will affect shared memory.
Debugging complex systems becomes a much simpler task when the information needed to understand system status is at your fingertips.
We present important system information in intuitive ways to help you find problems faster :
- The OSA Explorer provides comprehensive views into the status of kernel objects, tasks, and resources.
- The Debugger allows complete postmortem application debugging that includes traversing the stack, browsing objects, and viewing memory and registers.
- The EventAnalyzer shows a timeline of system events occurring at intervals only microseconds apart.
Synchronous run control for multicore
Green Hills Software was one of the first companies to offer a probe and debugger solution for multicore debugging.
MULTI now offers features that make debugging multicore systems as straightforward as single core systems.
Key among these features is synchronous run control, which halts all cores as a unit when any core encounters a debugging condition.
For instance, when a core hits a breakpoint the target list clearly shows :
- which core(s) have hit the breakpoint
- what thread was executing on the core at the time
- what the other cores in the system were doing
Downloading code to a multicore target can be a complex and tedious process. MULTI can automatically handle downloading INTEGRITY to these targets.
For other types of operating systems and applications a simple configuration file can be used to automate the download and setup process.
3. Boost productivity

The MULTI Project Manager simplifies how you build and update your application.
Clean code is less likely to contain errors and is easier to test, understand, and modify—all factors that contribute to fewer bugs and greater reliability.
The Green Hills Compilers enable enforcement of clean coding conventions via industry standards such as MISRA 2004 as well as GHS Standard Mode,
which is a collection of Compiler warnings and errors that enforces a stricter coding standard than regular C and C++ .
GHS Standard mode is based on our long history of successfully deployed software and on our collaboration with customers who have achieved the same high level of reliability.
We’ve simplified building so that you can spend more of your valuable time designing your next product.
With the MULTI Builder, there’s no complicated build infrastructure to maintain. You can change your build configuration easily.
The Builder automatically analyzes the dependencies of your entire project and compiles and links as many files in parallel as possible,
taking full advantage of modern multicore systems.
The Builder and other sophisticated features significantly reduce the overhead of project development.
A seamlessly integrated project manager, editor, flash programmer, instruction set simulator,
and more enable you to jumpstart development and work more efficiently.
4. Debug embedded Linux
For engineers developing software for embedded Linux systems, MULTI for Linux brings the comprehensive debugging capabilities
needed to dramatically improve productivity and bring a more reliable product to market faster.
Traditionally, Linux engineers had to rely on debugging tools that offered only limited visibility and usefulness.
GDB—and its related front-ends such as Eclipse—are cumbersome to set up, difficult to use, and not always trustworthy.
As a result, developers often resort to the hit-and-miss effectiveness printf or printk commands.
Unfortunately, these provide only a very small window into complex system execution.
With MULTI for Linux, embedded engineers can now visualize and debug all aspects of an embedded Linux system
—including the Linux kernel, kernel threads, interrupt services routines, as well as user mode threads and processes—faster and more easily than ever before.
Linux debugging capabilities
- Comprehensive Linux kernel visualization—including shared memory regions, semaphores, message queues, and kernel modules
- Support for SMP multicore debugging
- Debug from kernel through user space with one debugger
- Debug native Linux and virtualized Linux (on INTEGRITY
- Multivisor virtualization technology)
- Debug loadable kernel modules and device drivers
- Easily debug process startup code
- Set and thread-specific breakpoints in kernel code
- Debug shared objects in virtual address spaces
- Handle breakpoints with minimum performance cost
- Debug multi-threaded interactions across processes
5. Maximize performance
Generate faster, smaller code
Green Hills optimizing compilers are the best on the market. On EEMBC benchmarks—the most widely accepted benchmarks in the embedded industry
—the Green Hills Compilers consistently outperform competing compilers to generate the fastest and smallest code for 32- and 64-bit processors.
The Green Hills Compilers use hundreds of the most advanced optimizations to significantly increase program execution speed and decrease size.
For example, advanced whole-program optimizations span function call boundaries to allow the Green Hills Compilers to operate on entire source bases.
As a result, the Compilers are able to eliminate unnecessary code and variables, inline across modules, and better analyze interprocedural aliases.
You can fine-tune Compiler output by enabling different combinations of optimizations and by configuring optimizations on a per-project, per-file, per-function, or even per-source-line basis. On most programs, the Green Hills Compilers offer a 20% improvement in speed over the GNU Compiler.
Pinpoint performance bottlenecks

The Profiler’s interface streamlines analyses, showing how often and for how long different tasks, functions, instructions, etc were called so you can pinpoint where to target optimization and testing efforts.
Using Green Hills’ exceptional PathAnalyzer, Profiler, and EventAnalyzer, you can easily identify and eliminate performance bottlenecks in your code.
The result is a faster, more streamlined application :
- The truly innovative PathAnalyzer provides a high-level, time-based view of every function executed in your program, making it easy to identify patterns in program flow and see where time is being spent. Instead of showing you only a shadow of your program’s execution, the PathAnalyzer provides the entire picture.
- For system optimization and analyses, the powerful Profiler provides unrivaled insight into program behavior. The profiler shows how much processor time is consumed by each task, function, source line, and assembly language instruction, making it easy to:
- find performance problems
- find coverage gaps and track test coverage of specific code
- share profile data with other uses
- collect and merge profile data from several tests or profile recordings
- The EventAnalyzer displays the length and frequency of INTEGRITY RTOS events, making it quickly apparent what operations take the most time and where optimization efforts should be focused.
6. Benefit from an expert

Green Hills software engineers use MULTI and our compilers every day.
Our team of productivity consultants can draw on this firsthand experience to ensure that you know how to realize the full potential of your Green Hills products as well.
They can
- configure our tools to meet your specific requirements
- train you in the best use of our products
- evalutate your use and identify ways in which you can work more productively
And to obtain the highest possible performance, you can also turn your program over to our performance-tuning experts.
For three decades, we’ve been using our in-depth knowledge and best-in-class tools to beat every competitor on published benchmarks for program speed.
We can apply the same techniques that we use internally to make your application run faster.
We use our comprehensive knowledge to select optimal compiler optimizations for each part of your program.
Our performance-tuning service is not a commodity, it’s a custom service.
We’ll custom-write compiler optimizations based on our evaluation of your application and use our expertise in embedded systems to make your program run faster.
It’s not uncommon for our customers to see 300% or more improvement after working with us.
7. Lower your production cost
Reduce your processor costs
You don’t always need a faster processor to meet increasing performance requirements.
Our superior compiler optimizations are tuned to get the most out of whatever chip you use.
Additionally, our performance analysis tools such as the PathAnalyzer, Profiler, and EventAnalyzer give you a bird’s-eye view of where your program is spending its time,
helping you to focus your optimization efforts and speed up your application.
How much money would you save if you could use a lower-cost processor to meet the same real-time requirements?
Or if you could release a new product without having to produce a new hardware platform to run it on?
Not only will improving your application’s performance save you money on the processor itself, lower-cost processors operate at lower clock rates and require less power and cooling.
Longer battery life makes your product better and cheaper at the same time.
Reduce your memory costs
Green Hills Compiler optimizations reduce your memory costs by reducing the size of your executable.
Most programs see at least 10% improvement relative to the GNU Compiler.
Additionally, DoubleCheck finds memory leaks at compile time, and MULTI’s Memory Allocations tool searches for them dynamically at run time.
Maximize savings
Our team of cost reduction experts can help you to reduce your memory and processor requirements without sacrificing features.
We have reduced customer memory usage by over 30% and have improved performance by over 300%.
8. Functional safety confidence

The MULTI toolchain has been certified to meet the highest levels of tool qualification and C/C++ runtime certification:
- IEC 61508:2010 (Industrial), EN 50128:2011 (Railway) and ISO 26262:2011 (Automotive) functional safety standards
- Certificates received from both TÜV NORD and exida
- Satisfies both SIL 4 (Safety Integrity Level) and ASIL D (Automotive Safety Integrity Level) tool qualification and C/C++ runtime certification requirements—the highest levels achievable
- Supported on a broad set of target processors
The benefits to customers are simple and profound:
- lower cost and time-to-certification
- reduced product time-to-market
- reduced certification maintenance after product release
- application development support at highest SIL/ASIL levels
